CWB also operates a digital short-period telemetered seismic network (S13) which is the primary tool used for routine earthquake monitoring. The following table compares these two results, as well as that from the moment tensor solution by USGS using global digital stations around the world.
The epicenter, focal depth, and local magnitude values are essentially the same from the RTD or the S13. The latitude and focal depth agree well with the USGS solution, but the longitude differs for about 25 km. However, we may be talking about two different things: first P-arrivals give the initial point of rupture, whereas the moment tensor solution gives the point of the largest energy release.
Amplitudes from the short-period instruments are saturated, but RTD's ML value agrees well with the Mw value from the moment tensor solution.
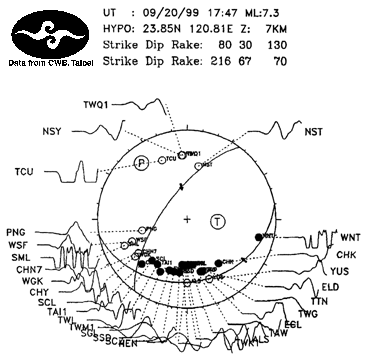
Focal mechanism was determined from first P-motions data of the S13 network, and is given in Figure 1 below:

Figure 1. Focal mechanism of the mainshock as determined from first P-motions.
This focal mechanism differs significantly from the USGS moment tensor solution. However, one of the nodal planes agrees:
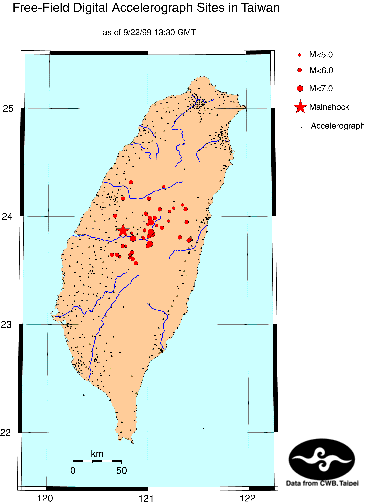
Since this nodal plane agrees with the general strike of the fault in the area and the trend of the early aftershocks (see Figure 2 below), we suggest that faulting occurred along this nodal plane.
|
Date |
Origin Time |
Latitude |
Longitude |
Depth (Km) |
ML |
Proc. Time |
|
9/20/99 |
17:47:15.89 |
23.87 N |
120.75 E |
10.0 |
7.3 |
102 sec. |
|
9/20/99 |
17:57:17.16 |
23.95 N |
121.03 E |
6.9 |
6.1 |
57 sec. |
|
9/20/99 |
18:03:42.64 |
23.80 N |
120.85 E |
5.0 |
6.5 |
75 sec. |
|
9/20/99 |
18:11:27.71 |
24.03 N |
120.98 E |
5.2 |
5.2 |
56 sec. |
|
9/20/99 |
18:16:21.01 |
23.86 N |
121.03 E |
13.5 |
6.9 |
85 sec. |
|
9/20/99 |
18:21:31.57 |
23.99 N |
121.07 E |
8.9 |
5.1 |
50 sec. |
|
9/20/99 |
18:32:55.60 |
23.82 N |
121.01 E |
2.9 |
5.2 |
62 sec. |
|
9/20/99 |
19:28:43.48 |
23.88 N |
120.97 E |
2.4 |
4.9 |
53 sec. |
|
9/20/99 |
19:40:33.27 |
23.57 N |
120.88 E |
2.5 |
5.4 |
55 sec. |
|
9/20/99 |
19:57:52.19 |
24.17 N |
120.75 E |
6.9 |
5.9 |
76 sec. |
|
9/20/99 |
20:02:15.36 |
24.01 N |
120.67 E |
2.5 |
5.7 |
69 sec. |
|
9/21/99 |
01:37:09.01 |
23.73 N |
120.75 E |
2.5 |
5.2 |
55 sec. |
|
9/21/99 |
02:24:46.48 |
23.93 N |
121.00 E |
8.4 |
4.9 |
56 sec. |
|
9/21/99 |
03:31:49.58 |
23.99 N |
121.02 E |
3.1 |
5.1 |
58 sec. |
|
9/21/99 |
06:36:27.73 |
24.02 N |
120.99 E |
6.9 |
4.7 |
48 sec. |
|
9/21/99 |
07:06:03.24 |
23.79 N |
121.42 E |
13.1 |
5.2 |
53 sec. |
|
9/21/99 |
07:46:04.79 |
24.07 N |
121.12 E |
3.7 |
5.2 |
57 sec. |
|
9/21/99 |
08:03:18.37 |
23.65 N |
120.64 E |
11.0 |
5.0 |
50 sec. |
|
9/21/99 |
09:10:17.66 |
23.85 N |
120.84 E |
1.0 |
4.7 |
50 sec. |
|
9/21/99 |
09:41:50.65 |
23.92 N |
121.09 E |
24.1 |
4.7 |
49 sec. |
|
9/21/99 |
09:56:04.62 |
23.81 N |
120.95 E |
1.0 |
4.5 |
55 sec. |
|
9/21/99 |
11:07:42.03 |
23.67 N |
120.84 E |
5.9 |
5.1 |
46 sec. |
|
9/21/99 |
11:39:34.87 |
23.63 N |
120.72 E |
12.4 |
4.9 |
47 sec. |
|
9/21/99 |
14:29:21.04 |
24.08 N |
121.26 E |
13.3 |
4.5 |
22 sec. |
|
9/21/99 |
14:32:14.13 |
24.07 N |
121.38 E |
21.4 |
5.0 |
58 sec. |
|
9/21/99 |
14:40:04.27 |
24.32 N |
120.83 E |
2.5 |
5.0 |
62 sec. |
|
9/21/99 |
15:28:10.85 |
23.61 N |
120.85 E |
2.5 |
5.1 |
49 sec. |
|
9/21/99 |
15:47:22.70 |
23.80 N |
120.96 E |
6.5 |
4.6 |
51 sec. |
|
9/21/99 |
17:38:36.77 |
23.81 N |
121.32 E |
13.7 |
5.2 |
53 sec. |
|
9/21/99 |
18:18:37.47 |
24.17 N |
121.01 E |
2.5 |
5.0 |
53 sec. |
|
9/21/99 |
18:58:40.11 |
23.73 N |
120.78 E |
1.6 |
4.7 |
50 sec. |
|
9/21/99 |
22:17:01.25 |
23.90 N |
121.14 E |
1.7 |
5.4 |
21 sec. |
|
9/21/99 |
22:17:03.78 |
23.95 N |
121.39 E |
9.9 |
5.1 |
52 sec. |
|
9/21/99 |
23:53:01.04 |
23.87 N |
120.97 E |
5.8 |
4.4 |
55 sec. |
|
9/22/99 |
00:14:40.91 |
23.84 N |
121.04 E |
7.5 |
6.8 |
107 sec. |
|
9/22/99 |
00:25:46.69 |
23.73 N |
121.00 E |
19.6 |
5.1 |
47 sec. |
|
9/22/99 |
00:31:58.06 |
24.11 N |
121.35 E |
5.0 |
4.2 |
23 sec. |
|
9/22/99 |
00:49:44.22 |
23.75 N |
121.02 E |
6.3 |
6.2 |
76 sec. |
|
9/22/99 |
02:19:33.00 |
23.78 N |
121.41 E |
11.6 |
5.2 |
57 sec. |
|
9/22/99 |
03:08:59.30 |
23.65 N |
120.82 E |
1.7 |
4.9 |
49 sec. |
|
9/22/99 |
03:47:48.58 |
23.83 N |
121.02 E |
8.5 |
4.6 |
61 sec. |
|
9/22/99 |
06:08:05.41 |
24.05 N |
121.22 E |
5.0 |
4.2 |
18 sec. |
|
9/22/99 |
06:10:03.24 |
23.62 N |
120.82 E |
1.0 |
4.7 |
47 sec. |
|
9/22/99 |
09:15:56.62 |
23.96 N |
121.21 E |
13.8 |
4.4 |
20 sec. |
|
9/22/99 |
12:35:48.35 |
23.65 N |
120.69 E |
1.0 |
5.0 |
50 sec. |
|
9/22/99 |
13:11:26.36 |
24.28 N |
121.16 E |
5.6 |
4.9 |
22 sec. |
|
9/22/99 |
13:30:16.50 |
23.63 N |
120.83 E |
11.7 |
4.6 |
50 sec. |
-------------------------------------------------------------
An epicenter map of the mainshock and the early aftershocks as listed above is given in Figure 2 below with the location of the free-field digital accelerographs in Taiwan. Some of the events listed above and plotted next are probably not aftershocks, but usual background earthquakes.

Figure 2. The mainshock and early aftershocks are shown with the accelerograph sites shown in the background.
As the seismic waves from the mainshock were so violent that many phone lines used in the telemetry were out shortly after the P-wave arrived. Consequently, the RTD system suffered from the lost of some stations. This indicates that a realtime seismic system performs no better than that of its weakest link. Fortunately, with sufficient number of stations, the RTD system performed reasonably well under this handicapped situation.
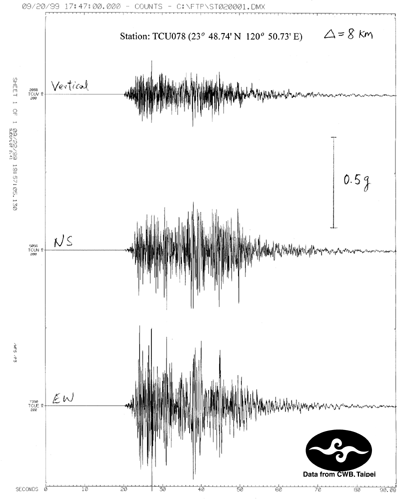
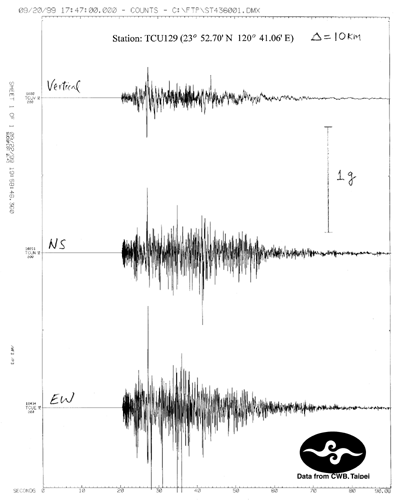
Now I have obtained the actual digital records from CWB. They are shown in Figure 3 and Figure 4 below.
Station TCU078 is located 8 km SE from the epicenter and Station TCU129 is located 10 km NW from the epicenter. Please note that no time correction has been applied yet, and further analysis will be made in the future.
In both cases, amplitudes of the EW-component are larger than that in the NS-component. Please note that these two accelerograms are plotted in different scales.

Figure 3. Accelerogram from Station TCU078 at epicentral distance of 8 km.

Figure 4. Accelerogram from Station TCU129 at epicentral distance of 10 km.
The URL of this page is http://www.diggles.com/chi-chi/chi-chi2.html
Date created: 09/23/1999
Last modified: 01/15/2002
Address questions to the author to: Willie Lee.
c/o U.S. Geological Survey, MS-977, 345 Middlefield Road, Menlo Park, CA 94025. (650) 329-4781 email to WillieAddress technical questions about this Web site to: Mike Diggles, Western Publications Group.
c/o U.S. Geological Survey, MS-951, 345 Middlefield Road, Menlo Park, CA 94025. (650) 329-5404 email to Mike